
Author: Alicia Webb
Contributors: Chris Blanksby, Natalie Lukies
Before building a wind farm, it’s crucial to monitor the wind resources at the proposed site. Wind speed is the single most important factor in how much energy a wind farm can produce. It's also important to measure the predominant wind direction, and environmental factors like air temperature, pressure and humidity so the air density can be calculated.
Why monitor the site?
It’s vital to develop a good understanding of the wind characteristics at a site — wind speed in particular. A slight difference in wind speed can have a significant effect on energy output. For example, a 10% increase in wind speed produces around 30% more energy, so the quality of a site's wind resource directly affects its economic viability.
Typically, a site is monitored for at least a year, to predict the wind farm’s likely output during its lifetime.
The complexity of the site's terrain is another key reason to conduct wind monitoring. It can lead to turbulent wind flow, which puts more mechanical load on wind turbines. Excessive turbulence can in some cases rule out a site altogether, regardless of the overall wind speed.
What does wind monitoring involve?
Wind monitoring usually involves placing a tall monitoring mast as close as possible to where a wind farm's turbine(s) might be located. The monitoring mast is a tall, thin, tubular or lattice mast with guy wires holding it up, and wind-measurement instruments mounted on it at various heights.
Wind monitoring involves several steps:
- Selecting a site
- Designing the mast, including its height and the type and number of instruments attached to it
- Buying or hiring the mast and the instruments
- Supervising installation and commissioning
- Producing a detailed installation report, recording all design specifications
- Analysing the data regularly.
- Mast maintenance
- Data conditioning and storage
- Completing a written Energy Resource Assessment report
Why measure wind speed?
Every type of wind turbine has a 'power curve' — a graph with wind speed on the x axis, (usually in metres per second, or m/s), and power output (kW) on the y axis. The curve helps predict how much electricity the wind turbine can produce. Here's an example:
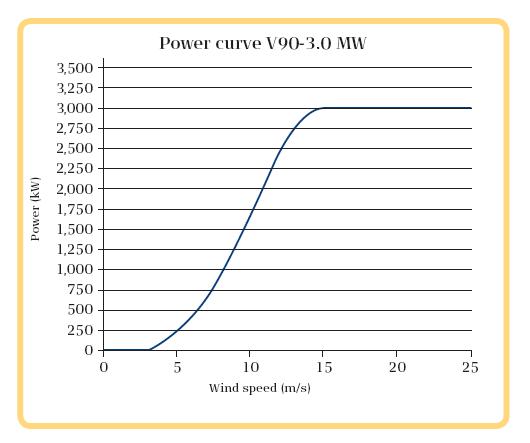
Wind turbine power curves have some common characteristics. They have a 'cut-in' wind speed, usually around 3 or 4 m/s. Below this wind speed, the turbine doesn't produce any electricity. Above cut-in wind speed the curves ramp-up, and as the wind speed increases, electricity output increases quite quickly. Eventually, the curve will flatten out at ‘rated’ wind speed and power output.
Every type of turbine also has a 'cut-out' wind speed, typically around 25 m/s. Very fast winds can damage the wind turbine, so it will temporarily shut down, and re-start when the wind speed drops back below 25 m/s.
Why monitor air density?
Wind speed isn’t the only thing that affects a wind turbine's power output. Air density is also important. Light, low density air produces less power at the same speed as heavy, dense air. Height above sea level, air temperature, pressure and humidity all affect air density, so wind monitoring projects typically monitor some or all of these characteristics so that the air density can be calculated.
Turbine manufacturers provide power curves for all of their different turbine models for different air densities, so it’s important to know which density to use in your calculations.
Why monitor wind direction?
Monitoring wind direction helps calculate the predominant wind directions at the site. Knowing which direction the wind usually comes from will influence where you put turbines, and how close together they can be. For example, if the wind typically comes from the south, you might decide to put turbines in a line that runs from east to west. Putting a turbine directly north of another would simply block it from the wind, and energy output would be greatly reduced by the 'wake' effect from this new turbine.
The output of wind monitoring
Before lending money to fund a project, banks will often ask a consultant to check the project's viability by performing an Energy Resource Assessment (ERA). A big part of this is the data from your wind monitoring project and the tower installation report, which describes the tower and its instruments. Your wind data will be a spreadsheet showing the monitoring timeline and averages for each sensor. In some cases, it will also show standard deviations, maximums and minimums. The tower installation report describes the design of the mast and details of all the instruments, plus the mounting arrangements — height, length and orientation of boom arms. Consultants use this data and information about the site to predict long-term energy yield.